Business intelligence
Dashboards and reports that bring your data together.
We connect the data you already have — databases, spreadsheets, CRMs and APIs — into online dashboards and reports your team actually uses for daily decisions.
What’s included
From scattered data to one clear view.
-
Data audit
We map your sources, owners and refresh needs, and agree which questions the dashboards must answer.
-
Data pipeline
Scheduled imports and transformations into one clean, documented data model.
-
Dashboards & reports
Online dashboards with the metrics, filters and exports each team needs.
-
Access control
Logins and permissions so each person sees the data they should.
-
Care & changes
Monitoring of data refreshes, plus new metrics and reports as your questions change.
How we price
Start small, with a written scope.
-
First dashboard
One data source, one audience, one clear set of metrics.
Fixed scope
-
Reporting platform
Several sources, roles and scheduled reports.
Per phase
-
Care
Refresh monitoring and new reports.
Monthly plan
Related work
-
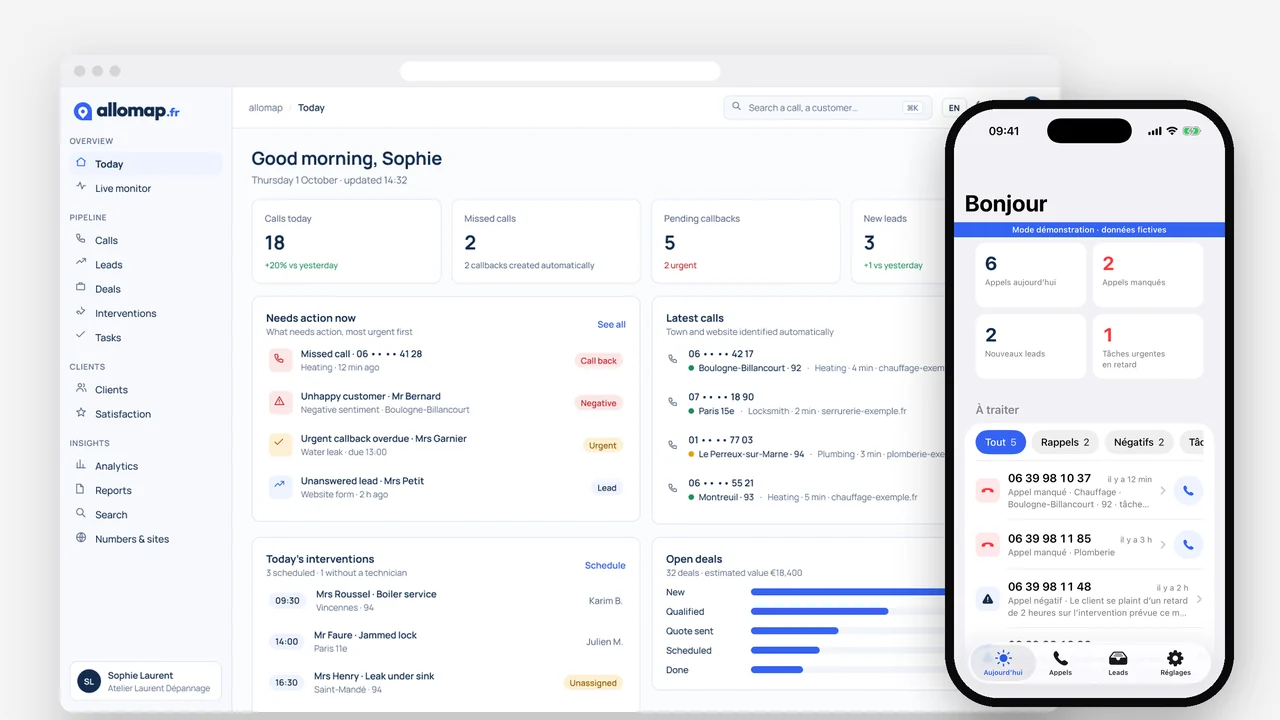
Web & iPhone app · Calls and leads
AlloMap
Every call to a repair business recorded, transcribed and analysed by AI, then turned into callbacks, deals and appointments. Web app live; iPhone app in development. Built for ZoomInSEO, a company our advisor Robert Eduard Antal also works with.
Read the case study
Questions
Business intelligence
Which data sources can you connect?
Databases, spreadsheets, CRMs and most tools with an API or export. We confirm each source in the discovery phase, before the quote.
Do we need a data warehouse first?
No. Many projects start with one or two sources and a small, clean data model; we only add more infrastructure when the data volume or number of sources calls for it.
Who can see the dashboards?
Only the people you give access to. Logins and permissions are part of every BI project.
How current is the data?
As current as the sources allow — from near real-time to daily refreshes. We agree the refresh schedule with you and monitor that it runs.